

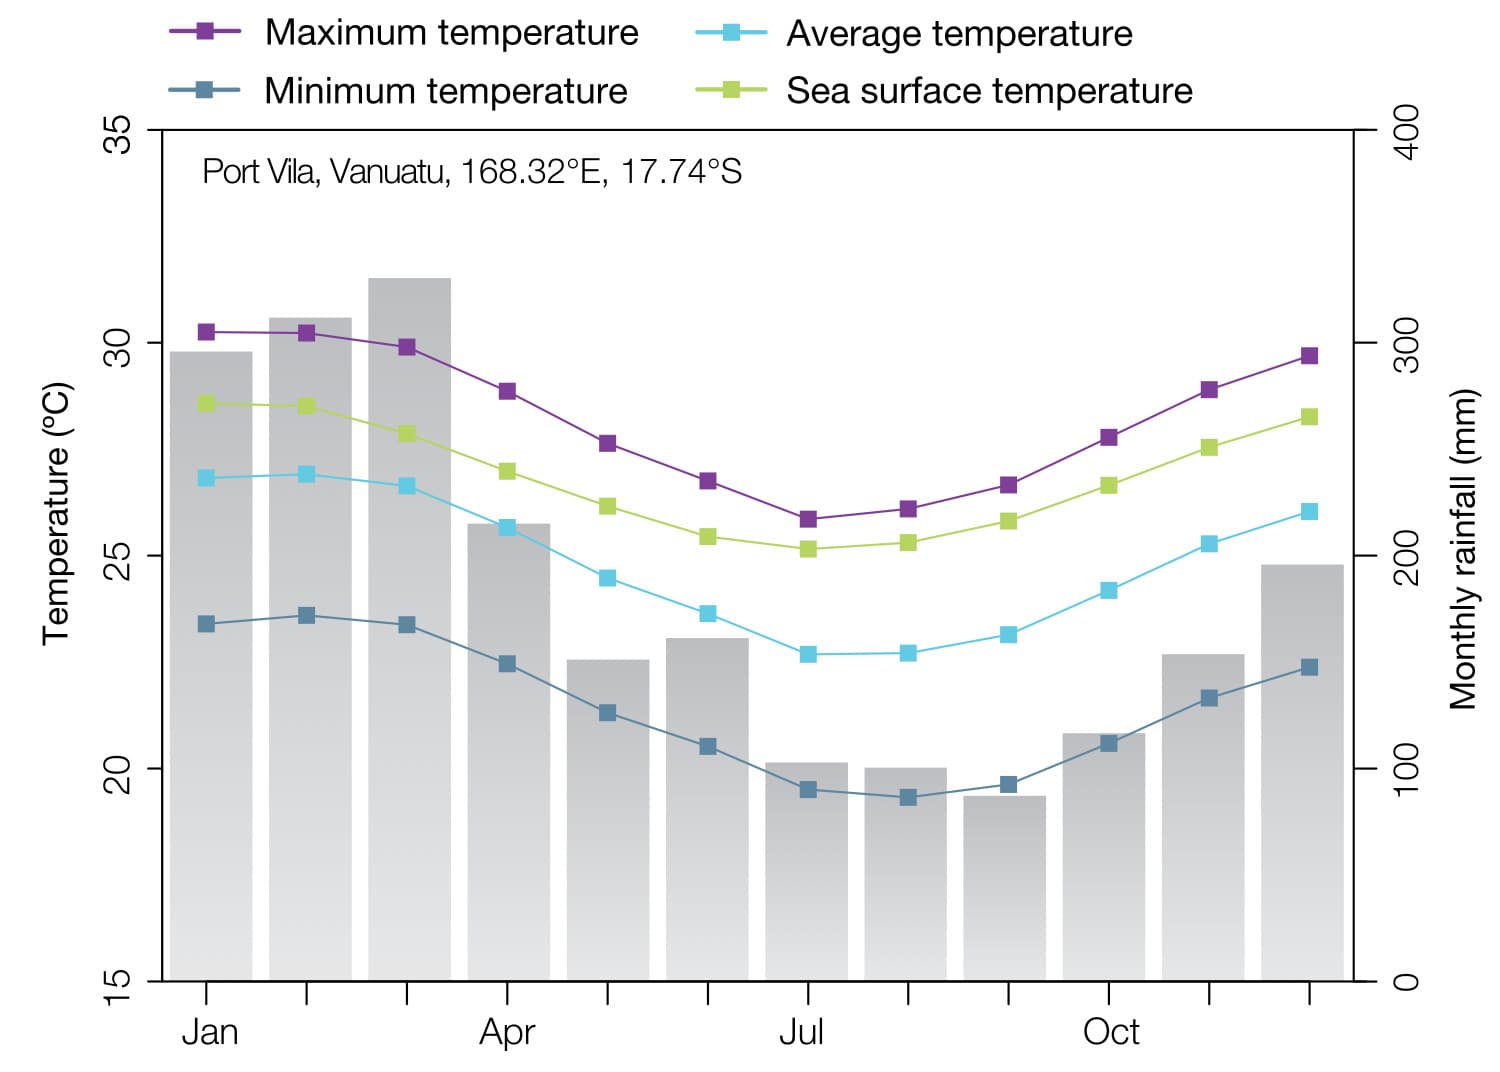
Climate
Climate showcases the temperature changes, current status of national ENSO, rainfall, SSL and coral bleaching. This page also includes jump offs for relevant pages to climate.
Current Vanuatu Climate Status
8 Weeks Coral Bleaching Outlook up to 31 August 2026

The 8 weeks coral bleaching outlook shows no stress for all of Vanuatu coral reefs, meaning all ocean activities can be carry out as usual.
Current ENSO Status: El Niño IS NOW FULLY ESTABLISHED.
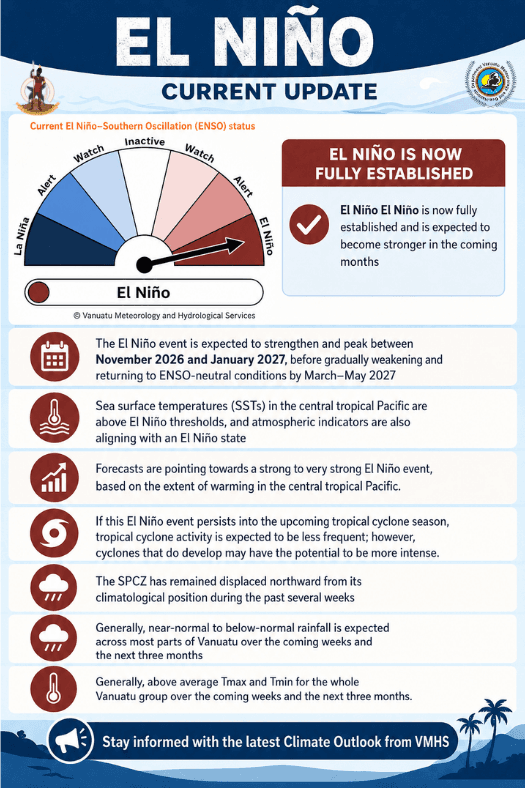
Communities that rely a lot on rainwater for their daily living need to start practicing water managements or preserve water because this event is expected to become strong in the coming months.
VANUATU RAINFALL OUTLOOK: 20 TO 26 JULY2026

Above rainfall is like for Tafea. Shefa and Malampa Province while near normal rainfall for Torba, Penama and part of Sanma Province.
TRADITIONAL KNOWLEDGE AND DRY SEASON
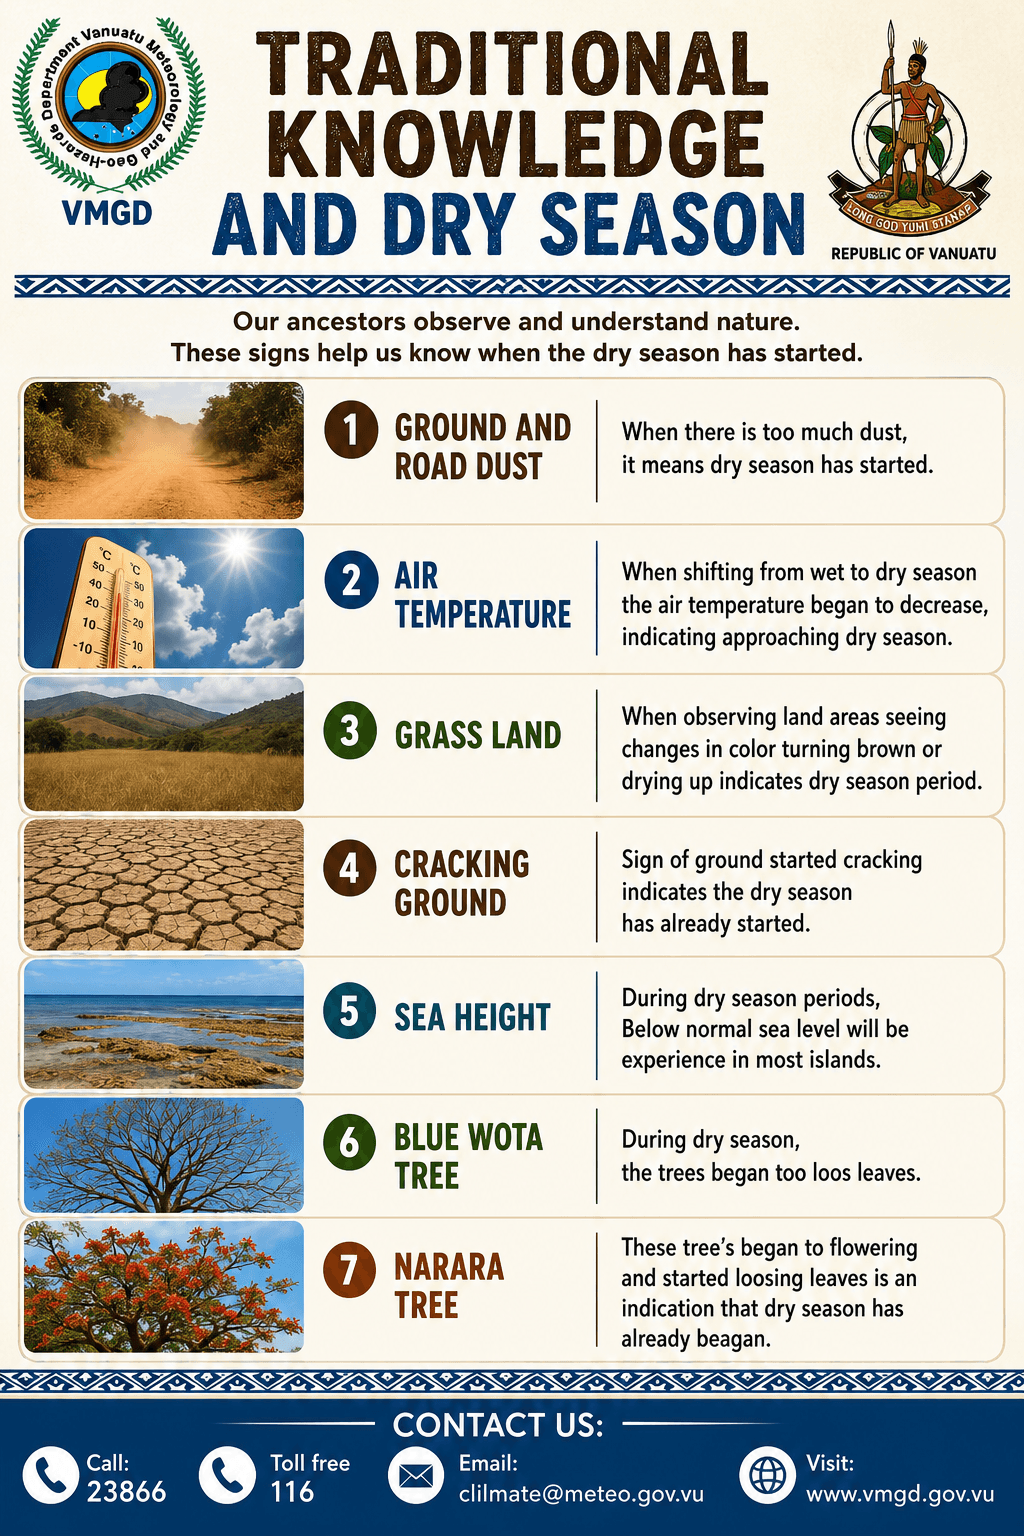
These are some of the common traditional indicators used by our communities as indicators for Dry season period.
Sectoral Climate Information Services
Climate Observation Stations

Climate Change Science Services
The Vanuatu Climate Futures Portal is a gateway to climate information services and tools, providing users with the science, mapping, data, videos and other resources to plan their adaptation actions. The Vanuatu Climate Futures Portal was developed by the GCF Vanuatu Klaemet Infomesen blong redy, adapt mo protekt (VanKIRAP) project.

Climate Mapping Tool
This interactive visualization tool allows you to select climate variables, greenhouse gas emissions pathways, time periods and locations to generate customised maps and datasets. You can visualise Area Council and Islands that are of interest to you.

Agriculture Mapping Tool
This interactive tool provides maps of current and future regions climatically suitable and diseases for Kava, Coffee, Cocoa, Taro and Yam using climate information services

Infrastructure Mapping Tool
This interactive visualisation tools allows you to map areas including roads and infrastructure inundation now and in the future (2030, 2050, 2070 and 2090) under various emission pathways

Fisheries Mapping Tool
This interactive visualisation tools allows you to map areas including Fisheries, Mangroves and Protected Areas. Users can also map historical and future marine heat waves

Tourism (Sea Level Rise) Mapping Tool
This interactive tool allows you to visualise sea level rise (current and future) for selected tourism pilot sites: Lonnoc Bamboo Beach, Lonnoc Beach Lodge, Lonnoc Ocean View Bungalows, Lonnoc Eco Beach Bungalows, Towoc Beach Bungalows, Champagne Beach and Towoc Beachfront Bungalows. Users can also visualise 10, 50 and 100 year return interval

Water (Extreme Flooding) Mapping Tool
This interactive mapping tool allows you to visualise extreme flooding areas in Efate (Mele Catchment) and Santo (Sarakata-Luganville Catchment) for 10, 50 and 100 year return intervals for low, medium and high emission scenarios.


